Homebuyer intel · 73 buildings checked
Buying in L-buurt, Amsterdam
L-buurt's housing spans several eras (0% pre-war, 0% post-war, 15% after 1990) — the building matters more than the buurt average here.
Median PlotScore
Buildings checked
Homes
Pre-war stock
Foundation risk (of assessed)
In the quiet band
Leefbaarometer 2024
Value percentile (city)
What the registers say
Foundation risk is comparatively low here — 0% of 68 assessed buildings flag elevated risk.
Noise varies street by street — 47% of buildings sit in the quiet band, at an average facade load of 55.4 dB. Check the specific address, not the buurt.
L-buurt prices below the Amsterdam median (value percentile 13) — which is exactly where mispriced gems and false bargains coexist. The per-building picture separates them. The official Leefbaarometer grades the area "zwak" (weak).
Energy labels — 50 registered (68% of buildings)
Construction eras
L-buurt on the Amsterdam atlas
Every building in Amsterdam is in the atlas, L-buurt included — coloured by value position, energy label, foundation risk, noise and the Leefbaarometer. Below is a capture of the real thing; the per-building detail comes with a PlotScore on the address itself.
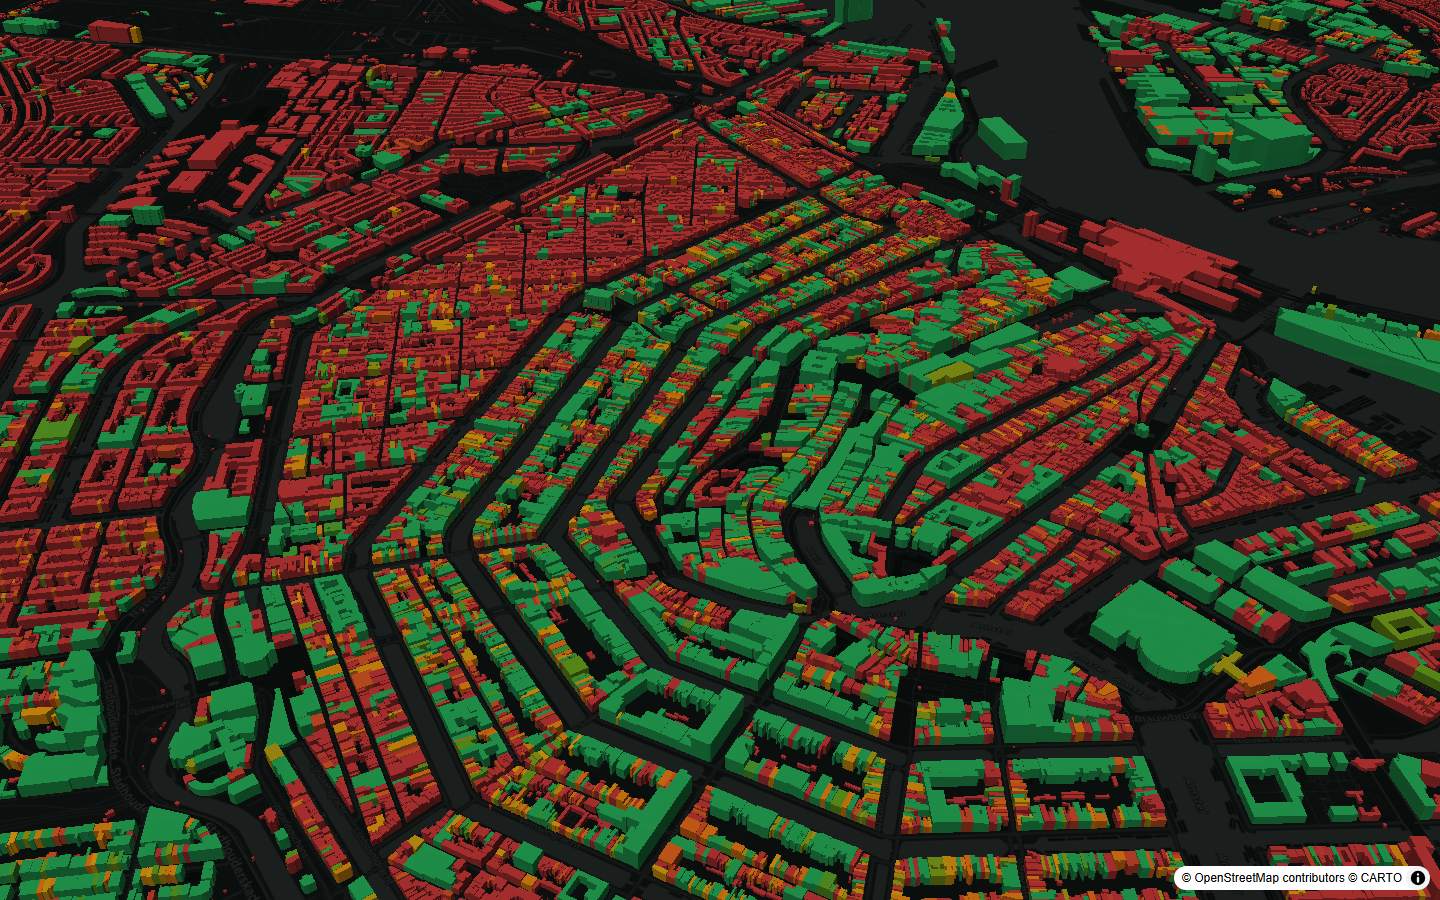
Property value
Product data · 183,755 buildings · Amsterdam · BAG · 3DBAG · WOZ · EP-Online · Netbeheer NL · CBS
Score a specific address →Layers in this atlas
- Property value — Every building's value position in the city — spot the streets where you'd overpay, and the ones nobody's noticed yet.
- Energy labels — 59,773 registered labels (EP-Online) — G-to-A is often the difference of a real monthly energy bill. Unlabelled stock stays dark.
- Foundation risk — ±54,000 pre-war buildings on wooden piles — the classic five-figure surprise. See the risk before you bid, not after.
- Noise — Traffic, rail and industry noise per building (RIVM) — the thing a Saturday-morning viewing can't tell you.
- Leefbaarometer — The official national liveability grade for every block — meting 2024, 100 m grid.
© OpenStreetMap contributors © CARTO
Next door
Eyeing a specific address in L-buurt?
The buurt view is the context — the decision needs the building. Run the full PlotScore on any address: 90+ factors, the viewing brief, and what the registers know that the listing doesn't say.
Figures are indicative, aggregated from public registers (BAG, 3DBAG, WOZ, EP-Online, RIVM, Leefbaarometer, CBS) as of 2026-07-17. They describe buildings we could assess, not a valuation of any specific property.