For municipalities & planners
The whole town,
on one map.
Per-building insight for entire towns — housing capacity, stock condition, energy transition, grid constraints, and honest scenario math for your housing programme. Evidence your council can interrogate.
A housing target lands on your desk and the answers live in ten different places: BAG, WOZ, EP-Online, CBS, the netbeheerders, the province, and a shelf of consultant PDFs. Each one is authoritative; none of them talk to each other. PlotScore bakes those registers into one living map of your town — every building scored, every claim traceable to its source.
Analysis layers
Factors per building
Official sources
Council-ready export
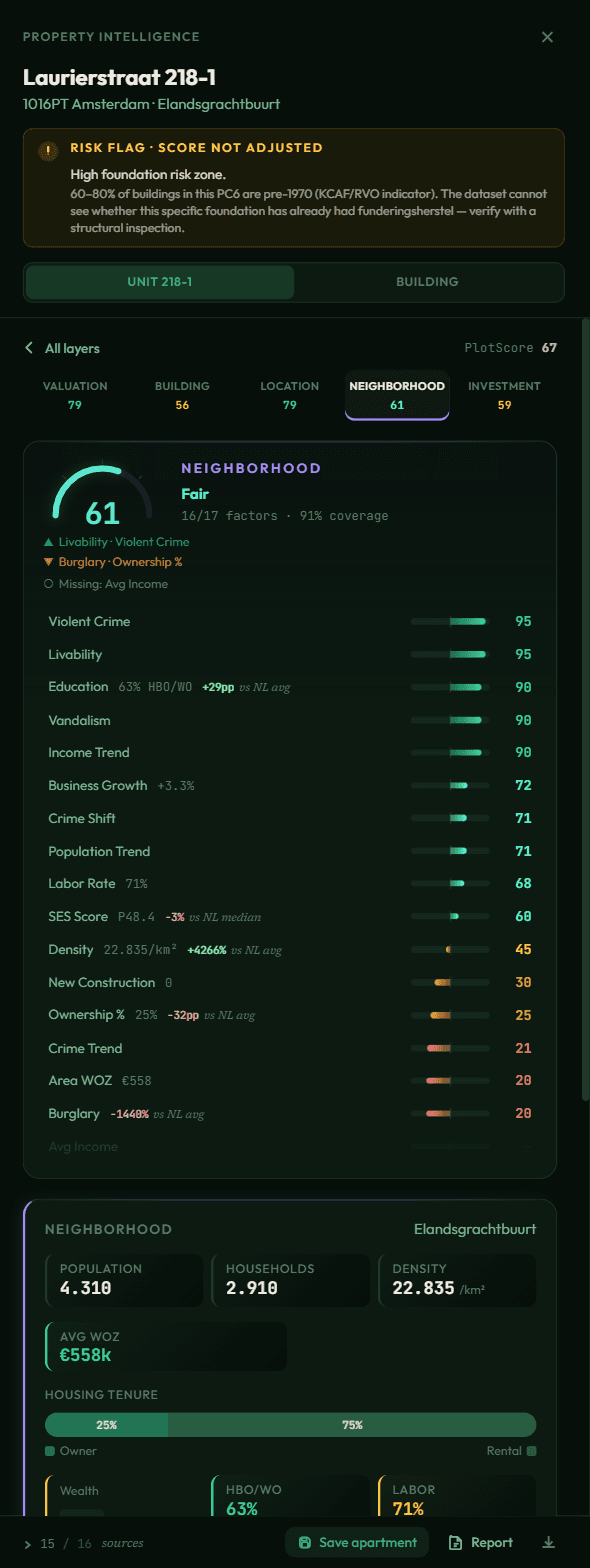
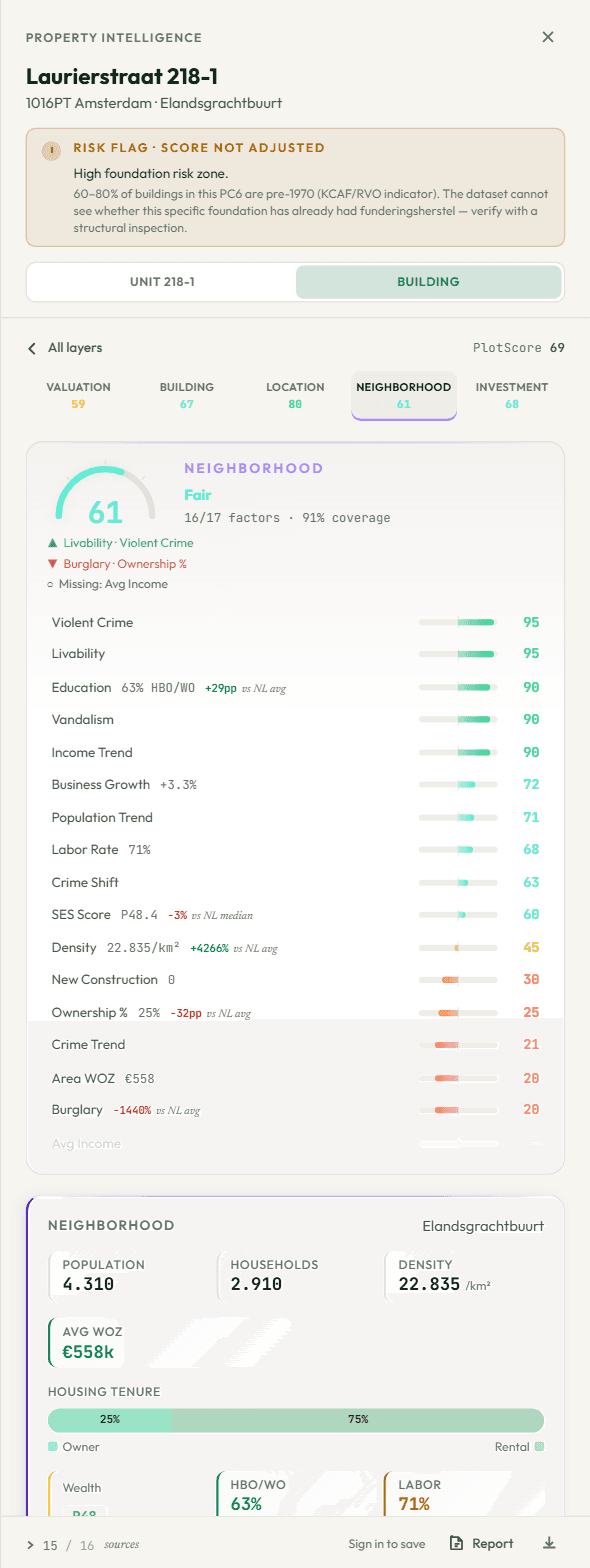
The actual product — not a mockup
Amsterdam. Every building. Right now.
This is the actual product running on the actual data: 183,755 Amsterdam buildings scored from the public registers. The layers a raad would ask about — property value, energy labels, grid capacity, foundation risk — are all in there. Then imagine it for your municipality: same registers, baked in a day.
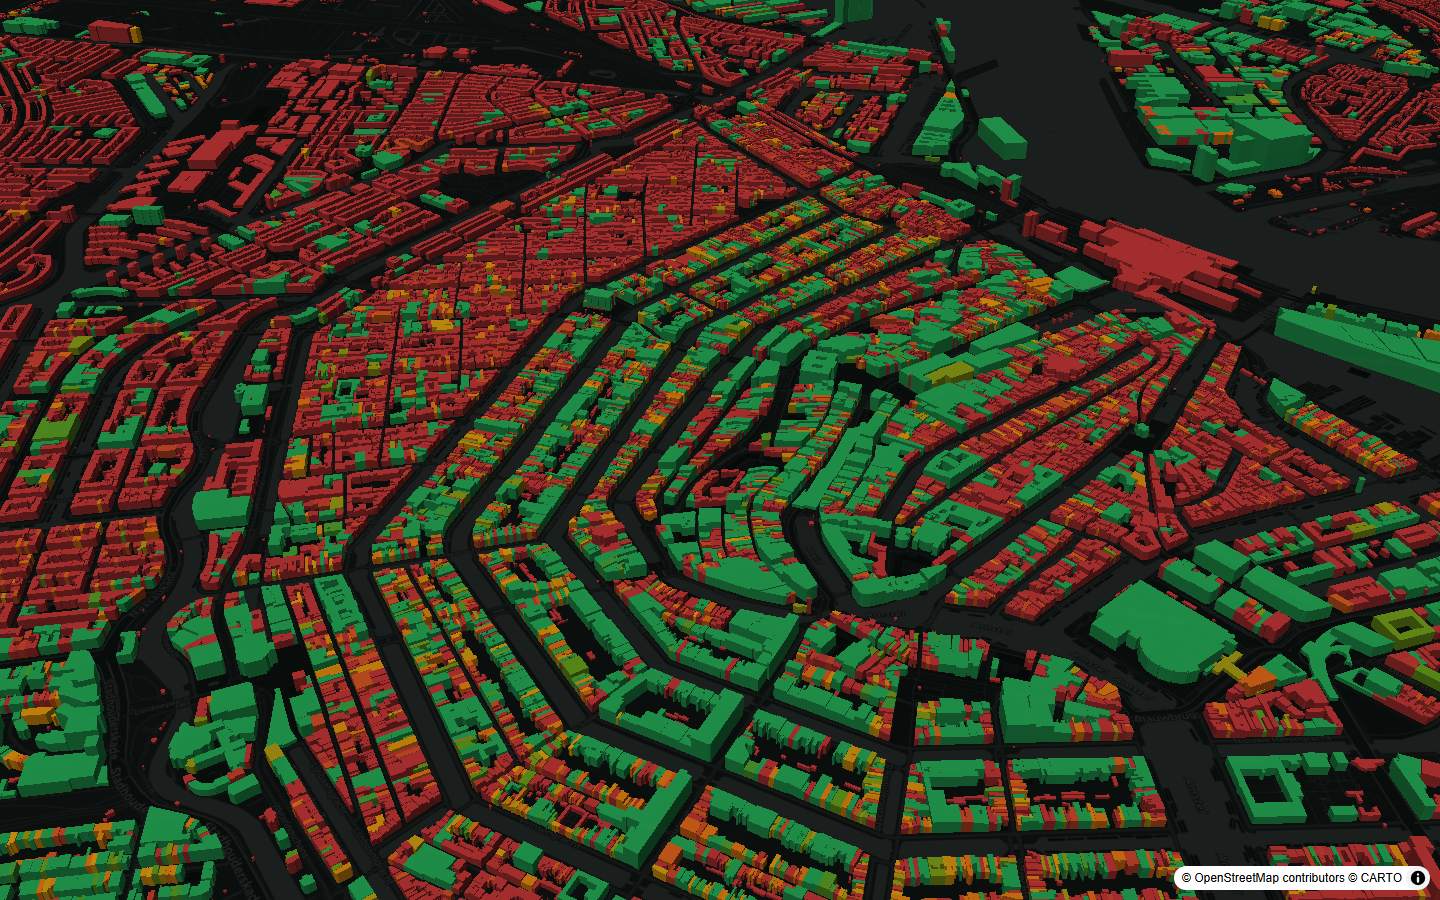
Property value
Product data · 183,755 buildings · Amsterdam · BAG · 3DBAG · WOZ · EP-Online · Netbeheer NL · CBS
Book a walkthrough →Layers in this atlas
- Property value — €205 billion of WOZ value on one map — where the tax base concentrates, building by building.
- Energy labels — 59,773 registered energy labels (EP-Online) — the starting grid for the heat transition. Unlabelled stock stays dark.
- Grid capacity — 106,037 buildings sit in feeders with an official afname shortage — the constraint a housing programme has to see early.
- Foundation risk — ±54,000 pre-war buildings on wooden piles — foundation risk mapped before it surprises the renovation programme.
© OpenStreetMap contributors © CARTO
Four of 20+ layers. The interactive atlas — 20+ layers, factor drilldowns, Areas, scenarios and exports — is part of Studio.
The problem
The data exists. The overview doesn't.
Every question in a housing programme — where can we densify, which stock needs renovation first, what can the grid actually absorb — has an answer sitting in public data. But it's scattered across viewers, portals, and bulk registers that were never designed to be read together, so each question becomes a memo, a work session, or a consultant engagement.
By the time the analysis is bound into a gebiedsvisie, it's a snapshot: months old, frozen in a PDF, impossible to re-run when the numbers change or the raad asks a follow-up question. The knowledge lives in the deck, not in your team.
PlotScore turns those registers into per-building maps and scenario arithmetic you re-run yourself, in minutes. When a site changes or a target moves, you drag a slider — not procure a revision.
Built for plan-making
What the town atlas delivers.
Every building, scored
A per-building choropleth across the whole town — overall score, five dimensions, and dozens of individual factors from WOZ €/m² to station distance, each one clickable down to its source.
Strategy layers
Densification opportunity, housing stock condition, heating low-carbon readiness, social resilience, amenity access, green vs. hardscape — the analysis maps a gebiedsvisie needs, computed from open registers.
Grid reality, both directions
Official Netbeheer capacity classes per feeding area — offtake and feed-in — with queue context and the upstream picture. Grid congestion is binding; your programme phasing should see it early.
Honest scenario math
Drop sites into a scenario and read the ledger the way a raad would: net homes versus gross, social share of production against your policy floor, parking land-take under local norms, phasing against real constraints.
Evidence maps, export-ready
Landscape identity, heritage, traffic, relief, building-age time-lapse — export any view as PNG or a multi-page PDF with sources and timestamps, ready for the council packet.
Confidential where it must be
Sensitive sites stay in your session at full fidelity, and are automatically anonymised in anything published or shared. Owner names, programmes, and notes never leak into a public view.
A real morning
Tuesday, 09:12.
The province asks how your municipality will place its share of the housing target. The old answer was a three-month study. Here's the new one.
- 09:12
Open the atlas
Every building in town, scored and colored. You flip through densification capacity, stock condition, and heating readiness — the shape of the opportunity is visible in the first ten minutes.
- 09:30
Test the programme
You drop candidate sites into a scenario. The ledger updates live: net homes after demolition, social share of production against the policy floor, parking land-take under your own norms.
- 09:50
Check the constraints
The grid layer shows which feeding areas are constrained and what's already queued; protected nature and flood-prone dips flag which sites need phasing or a different mix. The scenario flags the conflicts itself.
- 10:15
Export the evidence
PNG maps and a PDF with every source and timestamp go straight into the memo. When the numbers move next quarter, you re-run it — no revision procurement, no waiting.
Council-ready
Plans your raad can interrogate.
PlotScore Studio carries the town atlas and the scenario engine. We onboard your municipality's towns from the public registers, and we'll walk you through it on your own data.