Homebuyer intel · 40 buildings checked
Buying in Plan van Gool, Amsterdam
Plan van Gool is largely post-war reconstruction housing (60% from 1945–1970) — typically systematic builds where energy renovation state drives the real running costs.
Median PlotScore
Buildings checked
Homes
Pre-war stock
Foundation risk (of assessed)
In the quiet band
Leefbaarometer 2024
Value percentile (city)
What the registers say
Foundation risk is comparatively low here — 0% of 31 assessed buildings flag elevated risk.
Noise varies street by street — 57% of buildings sit in the quiet band, at an average facade load of 54.1 dB. Check the specific address, not the buurt.
Plan van Gool prices below the Amsterdam median (value percentile 13) — which is exactly where mispriced gems and false bargains coexist. The per-building picture separates them. The official Leefbaarometer grades the area "zwak" (weak).
Energy labels — 22 registered (55% of buildings)
Construction eras
Plan van Gool on the Amsterdam atlas
Every building in Amsterdam is in the atlas, Plan van Gool included — coloured by value position, energy label, foundation risk, noise and the Leefbaarometer. Below is a capture of the real thing; the per-building detail comes with a PlotScore on the address itself.
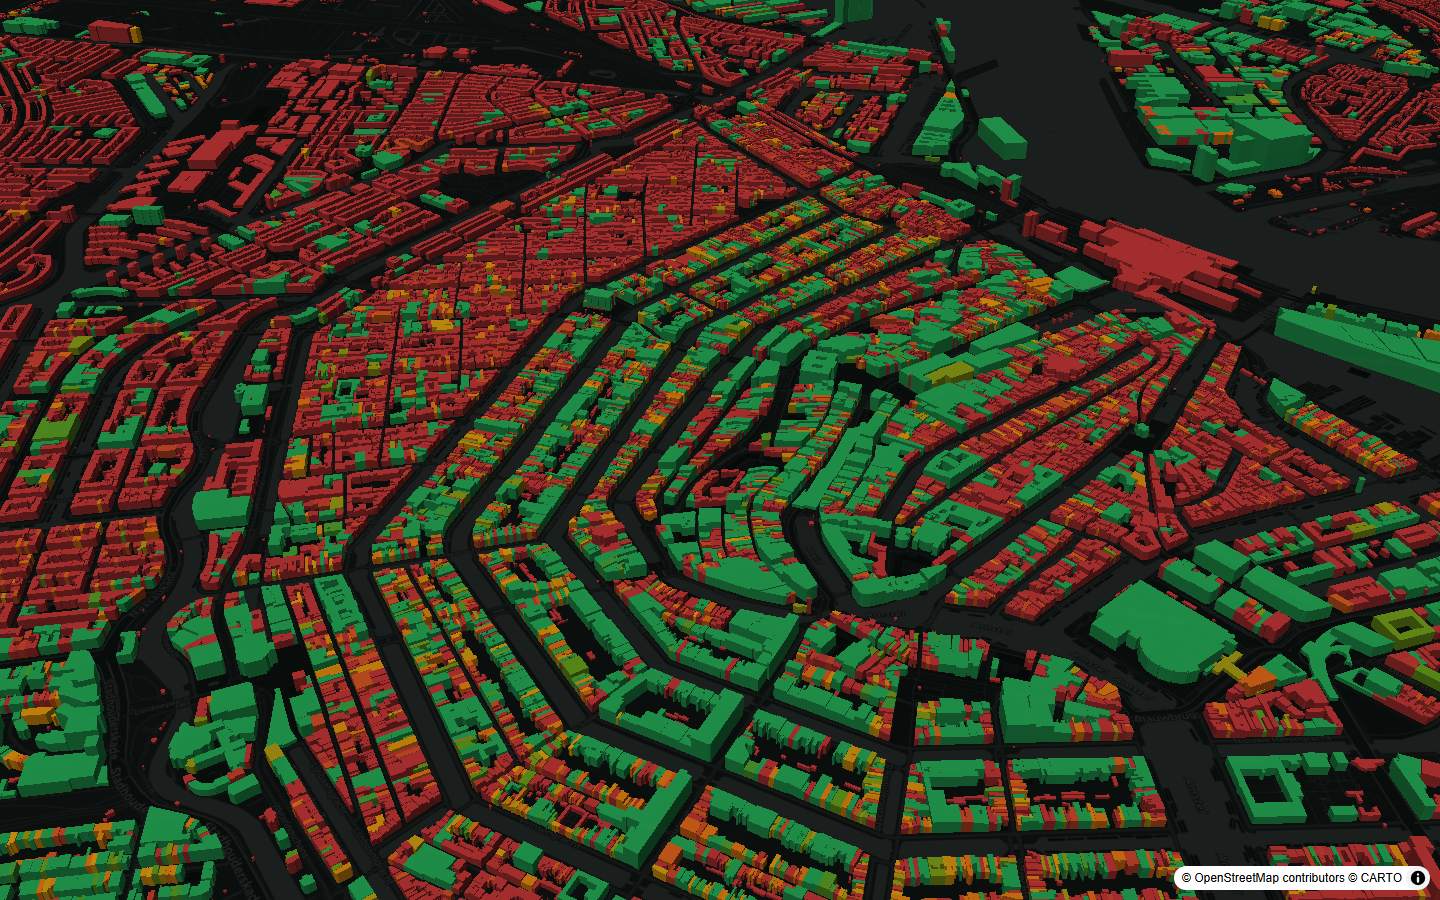
Property value
Product data · 183,755 buildings · Amsterdam · BAG · 3DBAG · WOZ · EP-Online · Netbeheer NL · CBS
Score a specific address →Layers in this atlas
- Property value — Every building's value position in the city — spot the streets where you'd overpay, and the ones nobody's noticed yet.
- Energy labels — 59,773 registered labels (EP-Online) — G-to-A is often the difference of a real monthly energy bill. Unlabelled stock stays dark.
- Foundation risk — ±54,000 pre-war buildings on wooden piles — the classic five-figure surprise. See the risk before you bid, not after.
- Noise — Traffic, rail and industry noise per building (RIVM) — the thing a Saturday-morning viewing can't tell you.
- Leefbaarometer — The official national liveability grade for every block — meting 2024, 100 m grid.
© OpenStreetMap contributors © CARTO
Next door
Eyeing a specific address in Plan van Gool?
The buurt view is the context — the decision needs the building. Run the full PlotScore on any address: 90+ factors, the viewing brief, and what the registers know that the listing doesn't say.
Figures are indicative, aggregated from public registers (BAG, 3DBAG, WOZ, EP-Online, RIVM, Leefbaarometer, CBS) as of 2026-07-17. They describe buildings we could assess, not a valuation of any specific property.